
When you have a large amount of content to display online, organizing that data becomes crucial, not just for design, but for user experience and SEO. Poorly structured information can confuse visitors and harm your site’s credibility. That’s why using tables to organize and present data on your WordPress site is a smart choice.
Whether you’re managing a financial website, publishing research findings, or comparing product features, data tables make it easy to showcase large datasets in a clean, readable format.
In this article, you’ll learn how to organize large datasets with the Data Table and enhance your site’s user experience—no technical skills needed.
Key Takeaways
- Learn how Data Tables help structure large datasets for better readability and SEO.
- Discover how to use Elementor Addon Elements’s Data Table widget to organize content without writing code.
- Explore features like sorting, searching, and custom styling to enhance user interaction.
- Read how to set up rows, columns, and headers for a well-structured table layout.
- Find ways to improve user experience and search engine rankings using structured content.
What is a Data Table in Elementor?
A Data Table in Elementor is a widget (available through addons like Elementor Addon Elements) that lets you display structured data in a tabular format, without any coding. It allows you to present large amounts of information in organized rows and columns, making it easier for users to scan, compare, and understand the content.
With the Data Table widget, you can easily insert dynamic data, customize columns, style your table layout, and even add sorting and searching options for better interaction. It’s perfect for showing pricing lists, schedules, product comparisons, reports, or any information-heavy content.
Why Should You Use a Data Table in Elementor?
Using a Data Table in Elementor offers multiple advantages for WordPress users:
- Improved Readability: Tables organize complex data so visitors can digest information quickly.
- Professional Presentation: Clean layouts make your site look more polished and user-friendly.
- Enhanced User Experience: Features like sorting, filtering, and responsive design make it easier for users to find what they’re looking for.
- Time-Saving: No need to hand-code or use external plugins—just drag, drop, and customize.
- SEO Benefits: Structured content helps search engines better understand your data, which can improve visibility in search results.
How to Add a Data Table in Elementor
Step 1: Install & Activate Plugin
To use the Data Table widget in Elementor, you’ll first need to install the Elementor Addon Elements plugin.
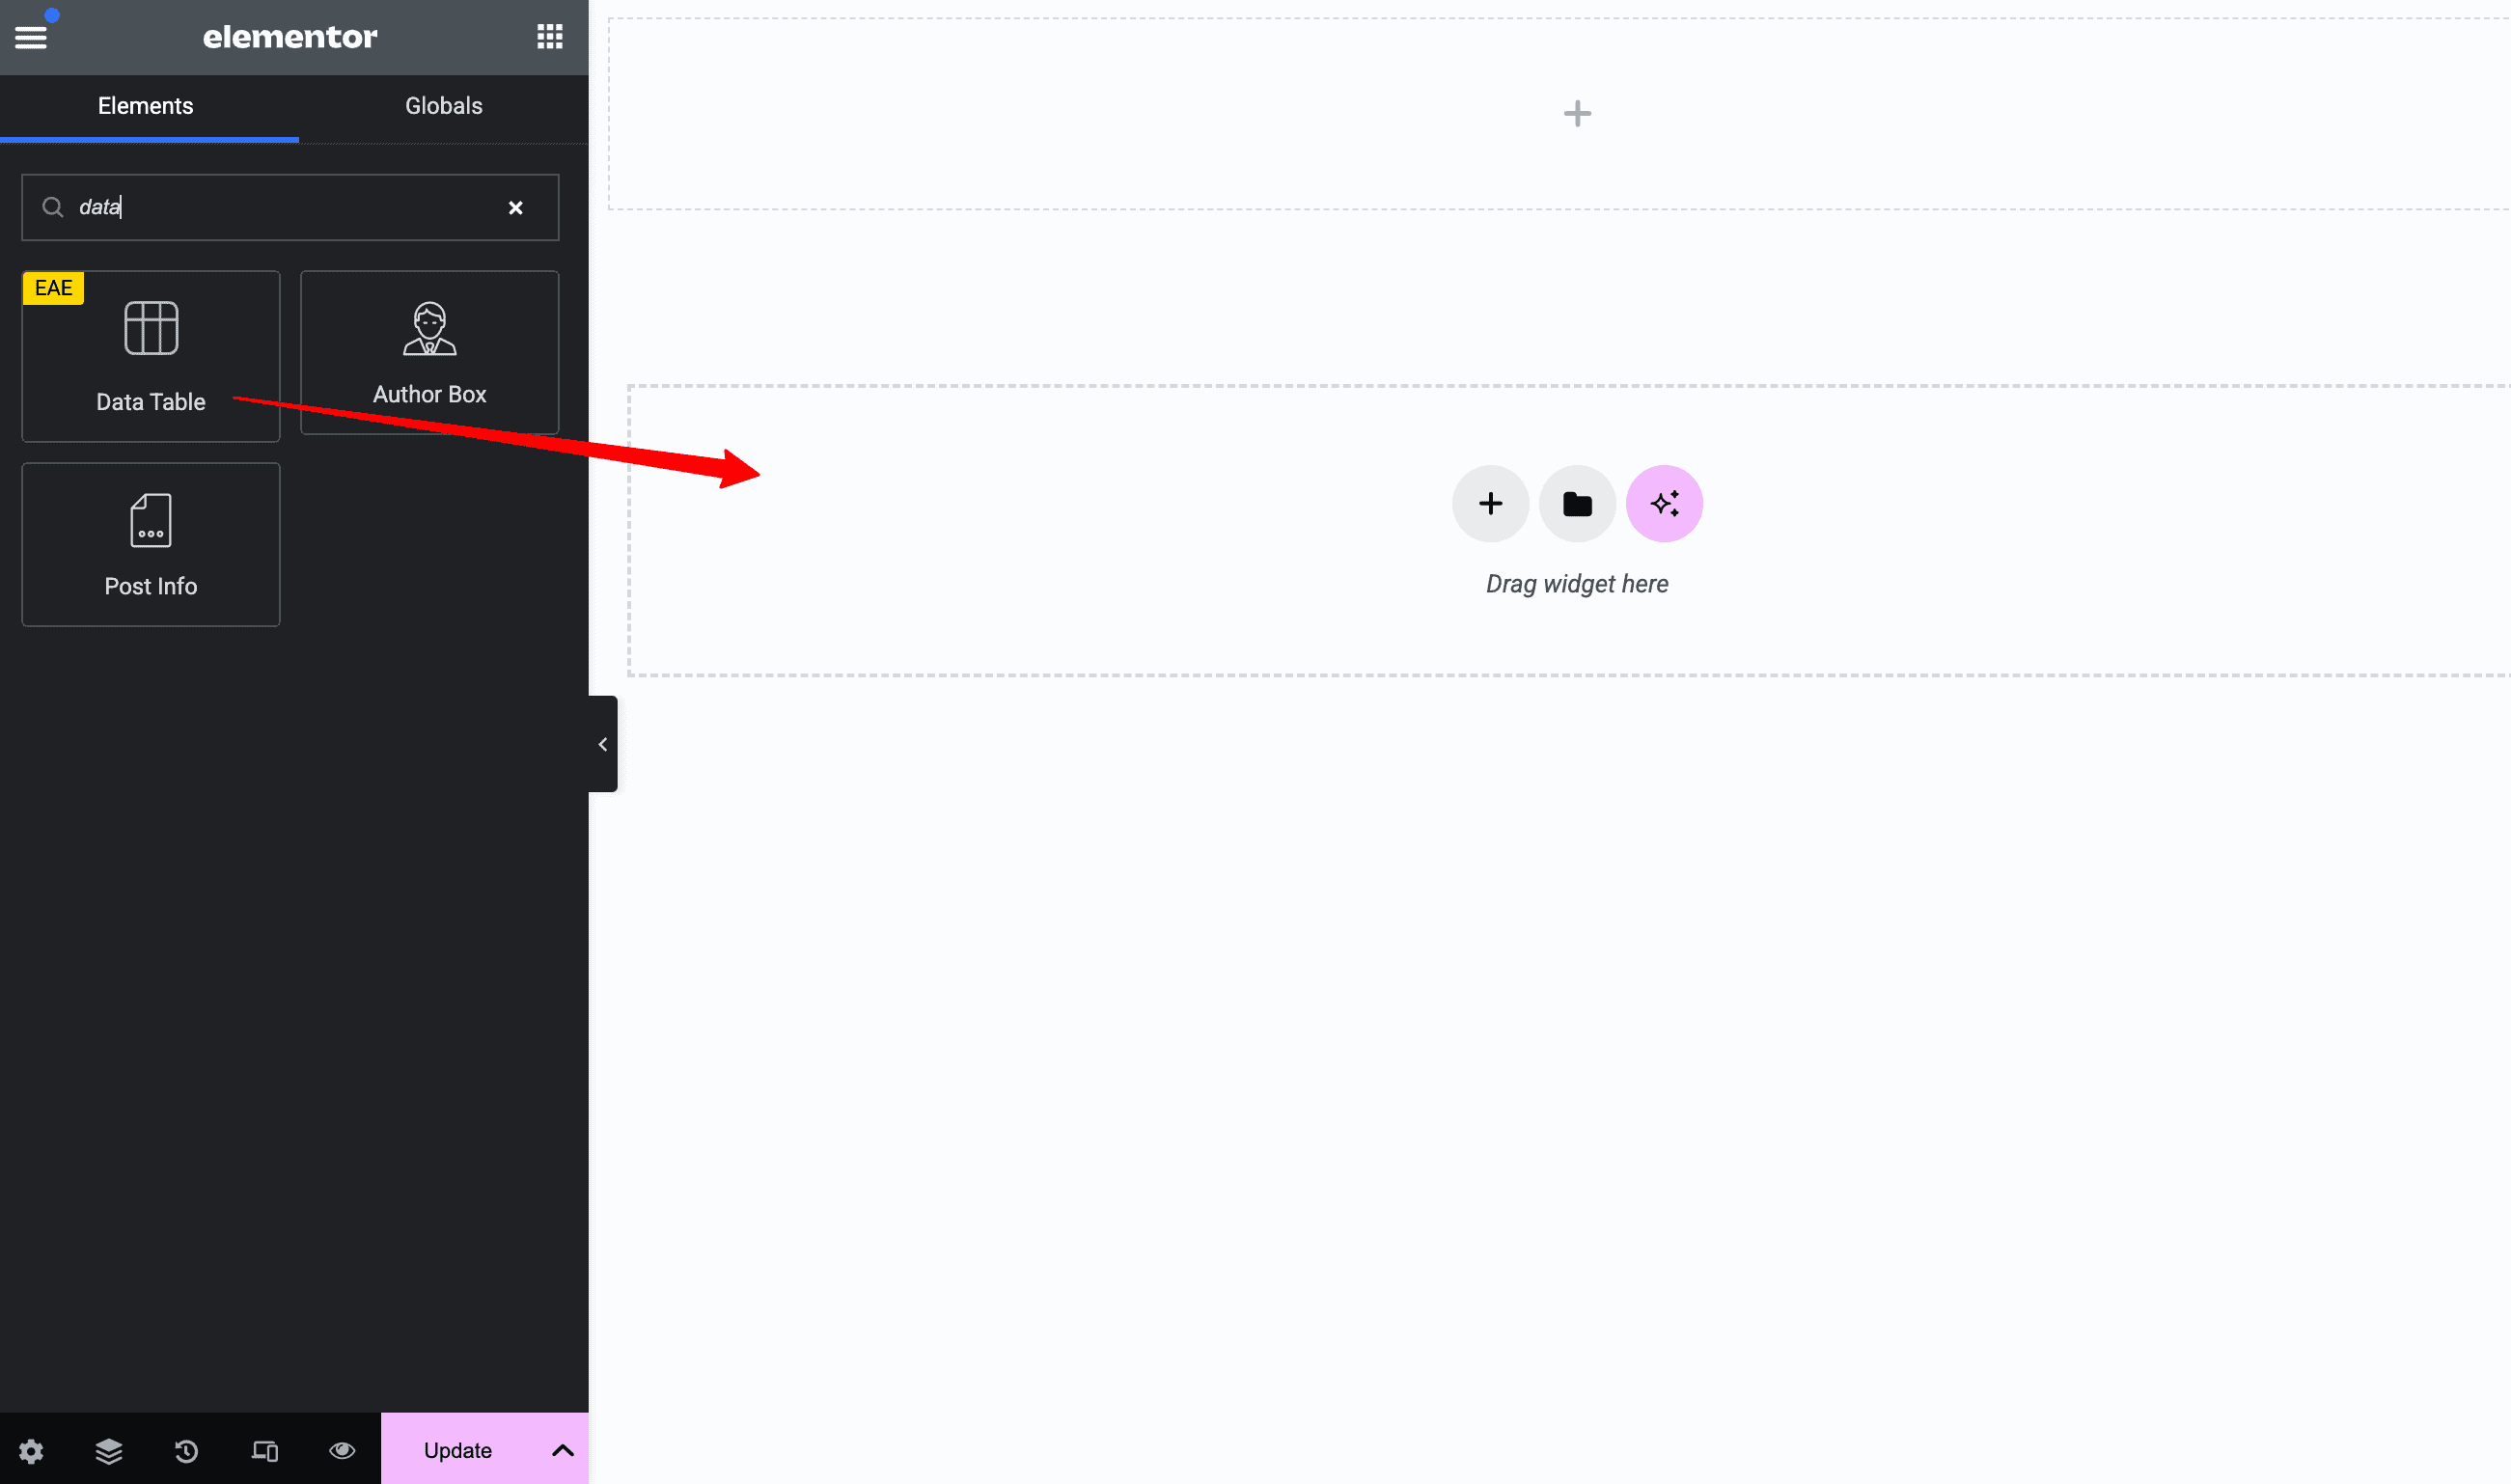
Step 2: Add the Data Table widget
Open your page with Elementor, then look for the Data Table widget in the left panel. Make sure it has the EAE badge in the top-left corner. Drag and drop the widget onto your page to start using it.
After you have added the element, the default structure of the table will look like this.

Step 3: Configure the Data Table
Under the Content tab, you will find three sections: – Header, Body, and Table Settings.
However, before beginning, let us see how we can add Rows and Columns to the table.
A new row will always start with the designation Row Start. To add a new Column, you need to add a new cell to the current row.
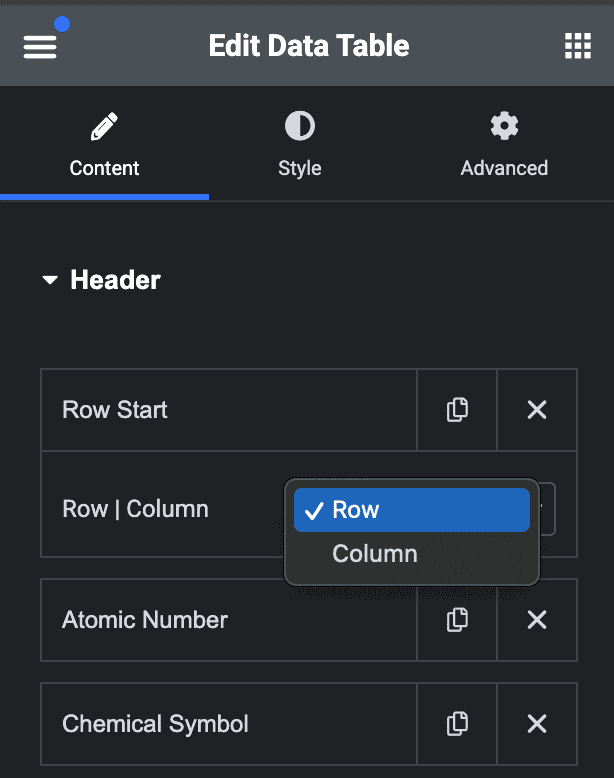
Header
From the Header section, you can create a Header Row for your table. Then, add the header field names inside the column. To create a header section for the table, we first need to insert a Row. A new row always starts with the designation “Row Start.” You can add any number of columns to the Row by clicking on the Add item button.
Insert the first Column in the header row by selecting Column. You will get three additional setting tabs to add Custom Content, an Icon, and give Custom Styling to an individual cell. You can change Column Span, Row Span, and adjust the alignment for this particular section.
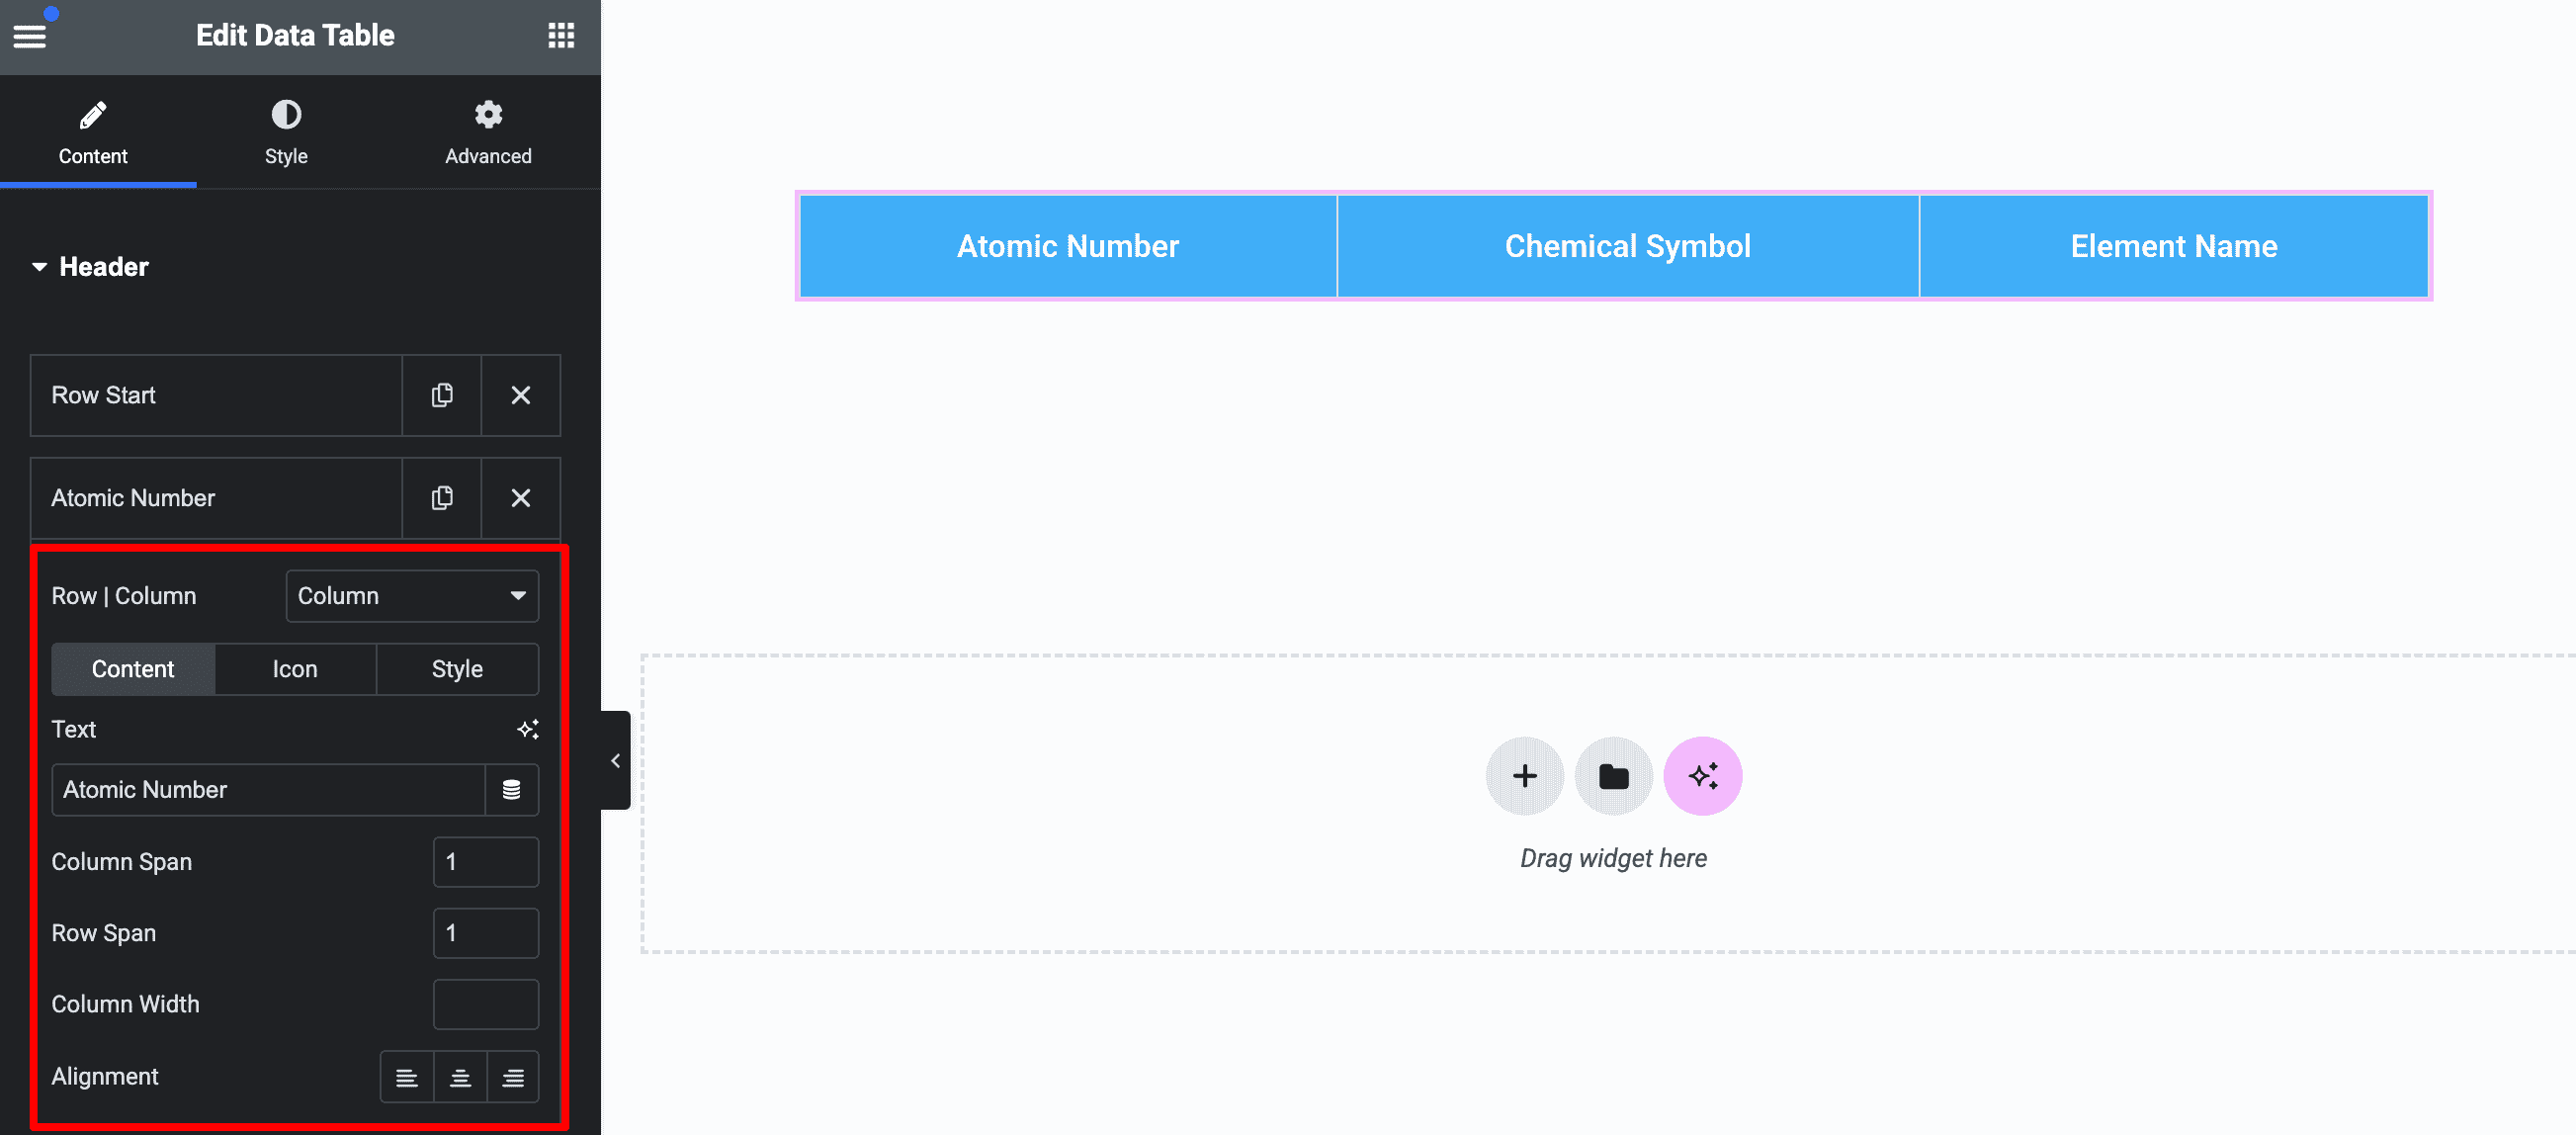
To add more columns to the header row, click on the Add Item button.
Body
It is where the main content area begins. Here you can add the actual content of your table.
Start by inserting a row first, and then add cells/ columns to the row.
You can insert text-based content inside the cells and add Saved Elementor’s Section / Templates and AE Templates.
The Column configuration settings are almost the same as we did for the header section.

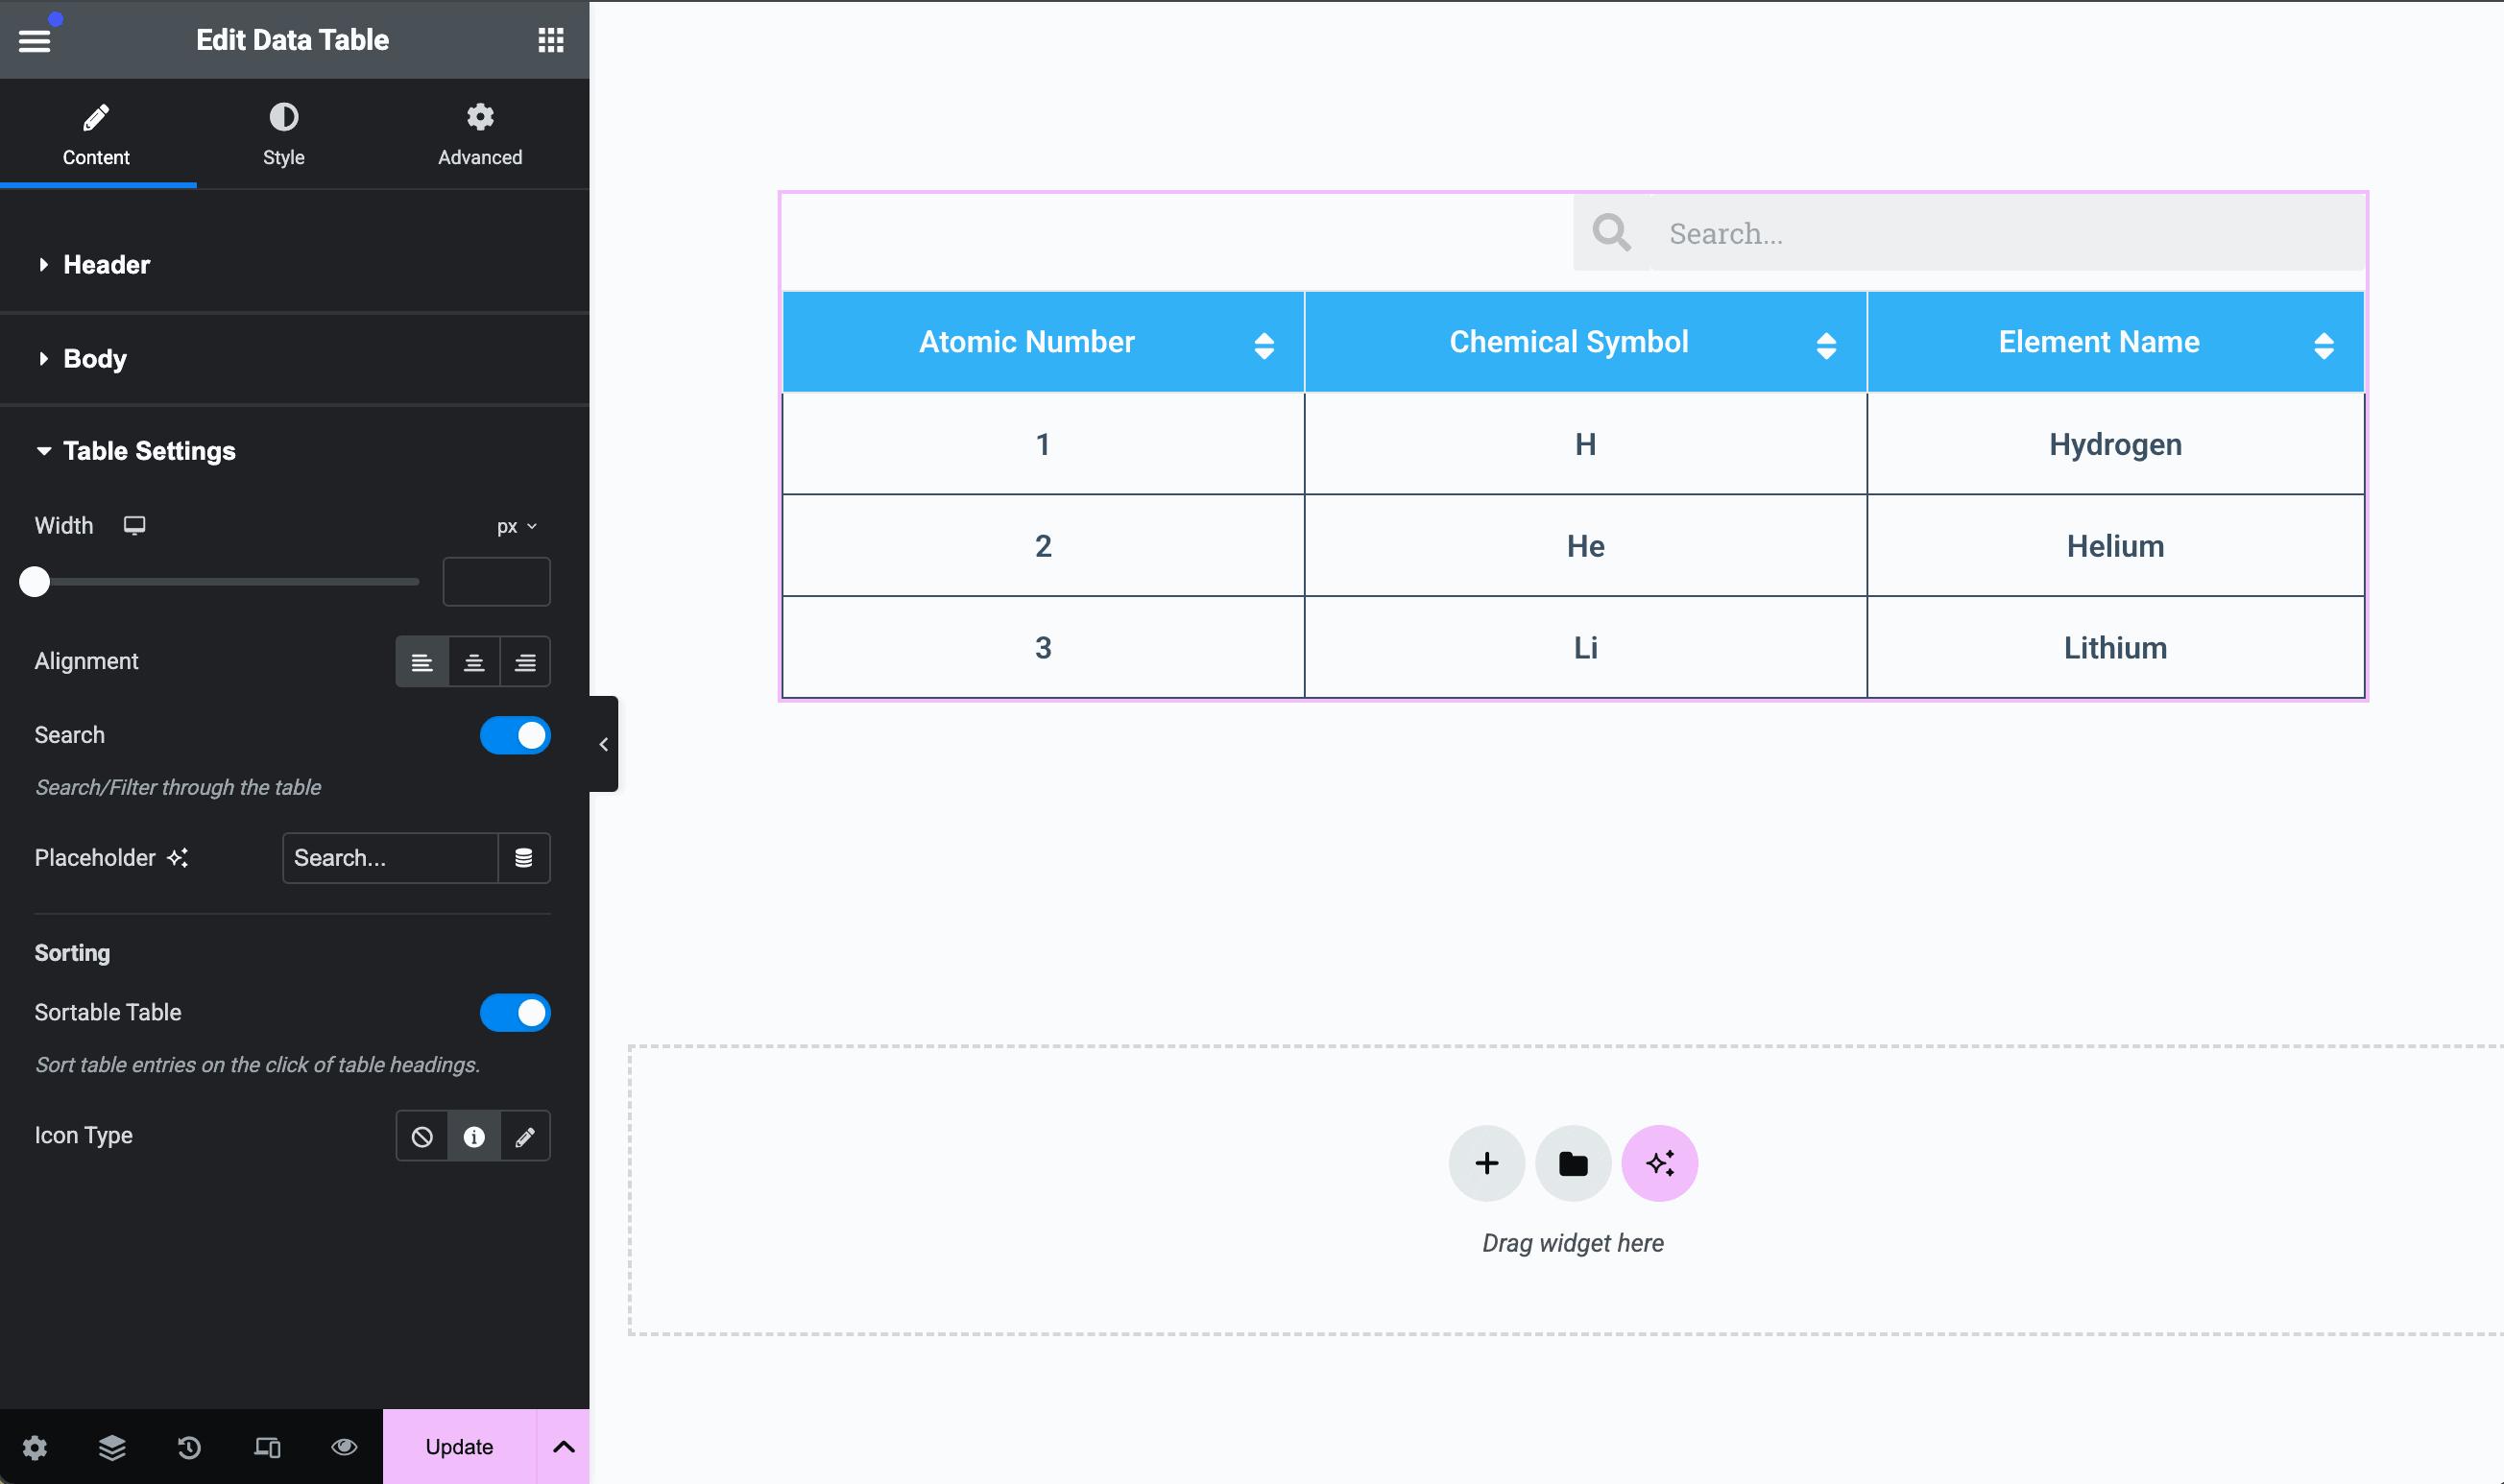
Table Settings
Once you are done adding the header section and the content inside the table, next comes some configuration settings. Under the Table Setting tab, you can adjust the table width and alignment.
The Data Table also gives you the functionality to filter the table data, enable the Search feature in the Table Settings to add a Search box at the top of the table. Similarly, you can sort the content inside the table by enabling the Sort option.
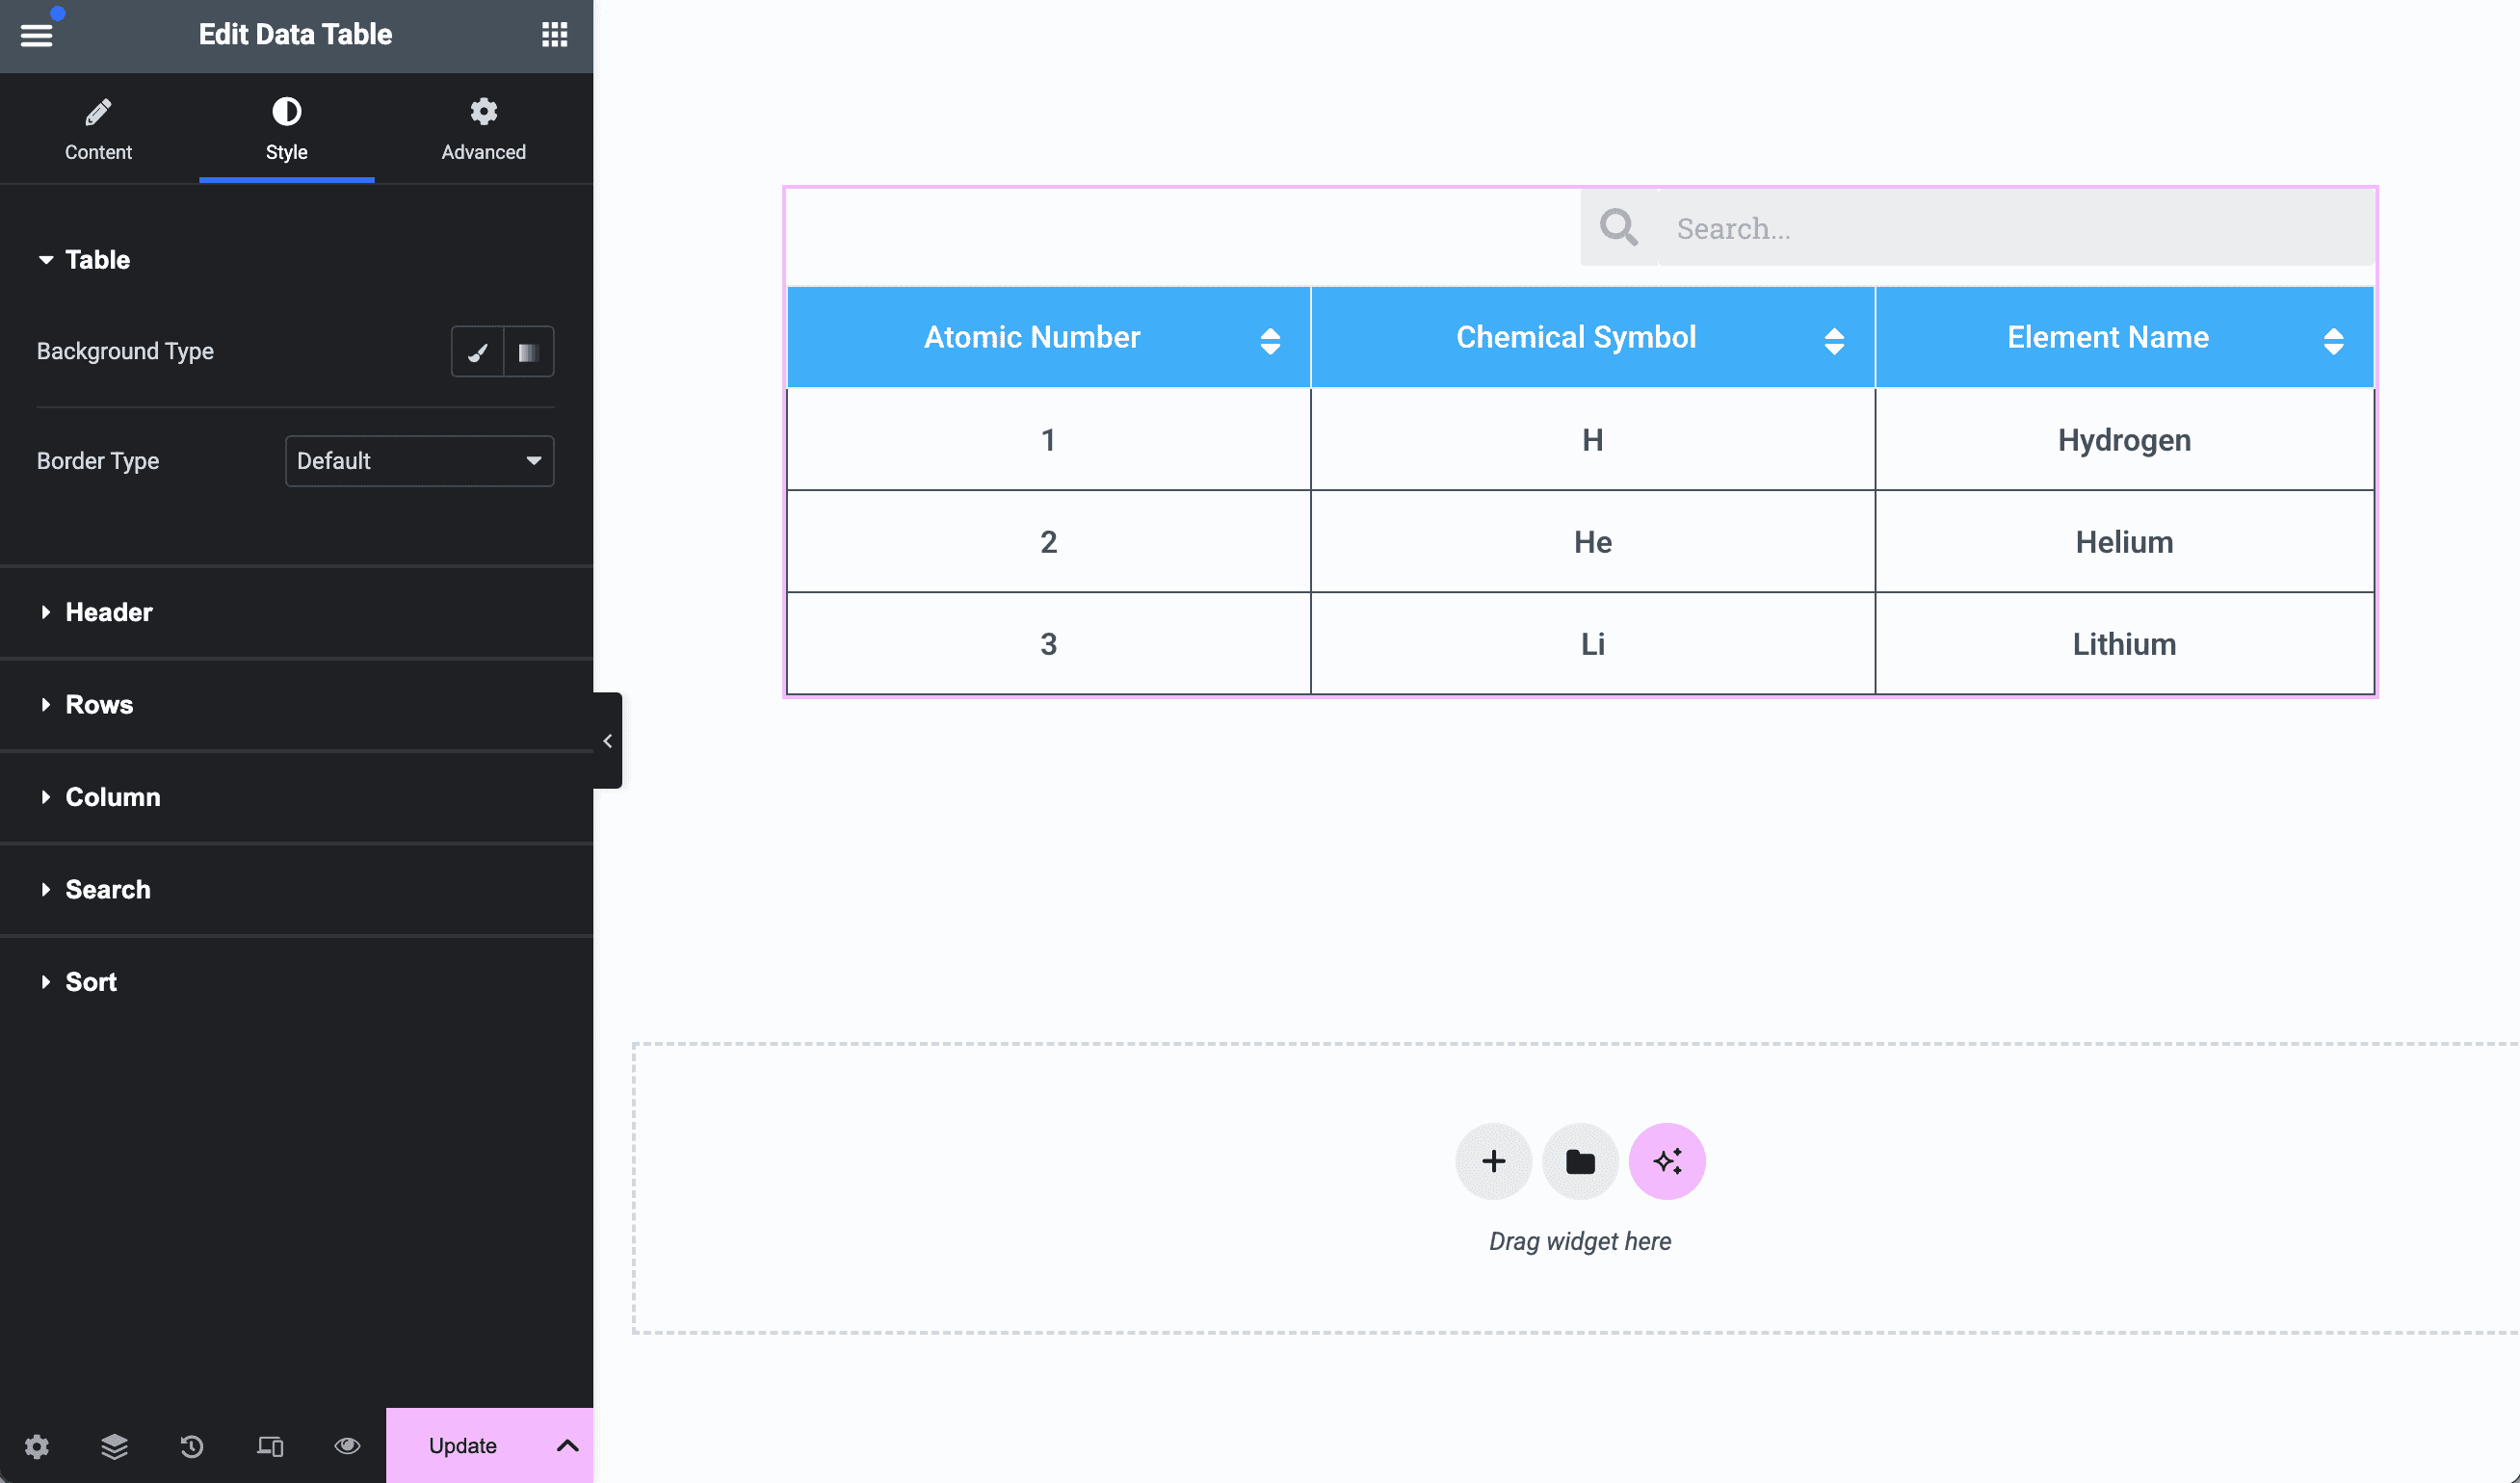
Step 4: Customize the Overall Table Appearance
Once you are done with setting up the table’s basic structure, switch to the Style tab to style all elements of the data table. For example, you can change the border color and header style, and style the rows and columns by giving them odd and even color coordination. Also give styling to the Search and Sort elements.
Final Output
Have a look at the final output generated; using a table structure makes information easy to understand and sort.

FAQs on Data Table in Elementor
What is the Data Table widget in Elementor?
The Data Table widget is part of the Elementor Addon Elements plugin that lets you display structured data in a table format on your WordPress site—no coding required.
Do I need Elementor Pro to use the Data Table widget?
No. The Data Table widget is available through the Elementor Addon Elements plugin, which works with the free version of Elementor.
Can I style individual cells or rows in the Elementor Data Table?
Absolutely. You can style header cells, content rows, alternate row colors (odd/even), and even add icons or templates inside cells.
What kind of content can I show using a Data Table?
You can show price lists, schedules, product comparisons, financial data, or any content that requires a structured layout.


Thank you for the amazing post, i really wanted a solution for creating a table. since i have a data to share, didn’t know which plugin to use.
but how can i insert large data such as Features of two particular things because i have blog about RANK MATH where i have to differentiate the FREE and PRO version??
Please let me know 🙂
Hi
Thanks a lot for appreciating this post.
I think instead of Data Table widget, you should use Comparison Table widget for this requirement.
You can check it here https://www.elementoraddons.com/tutorial/creating-comparison-table-in-elementor/